
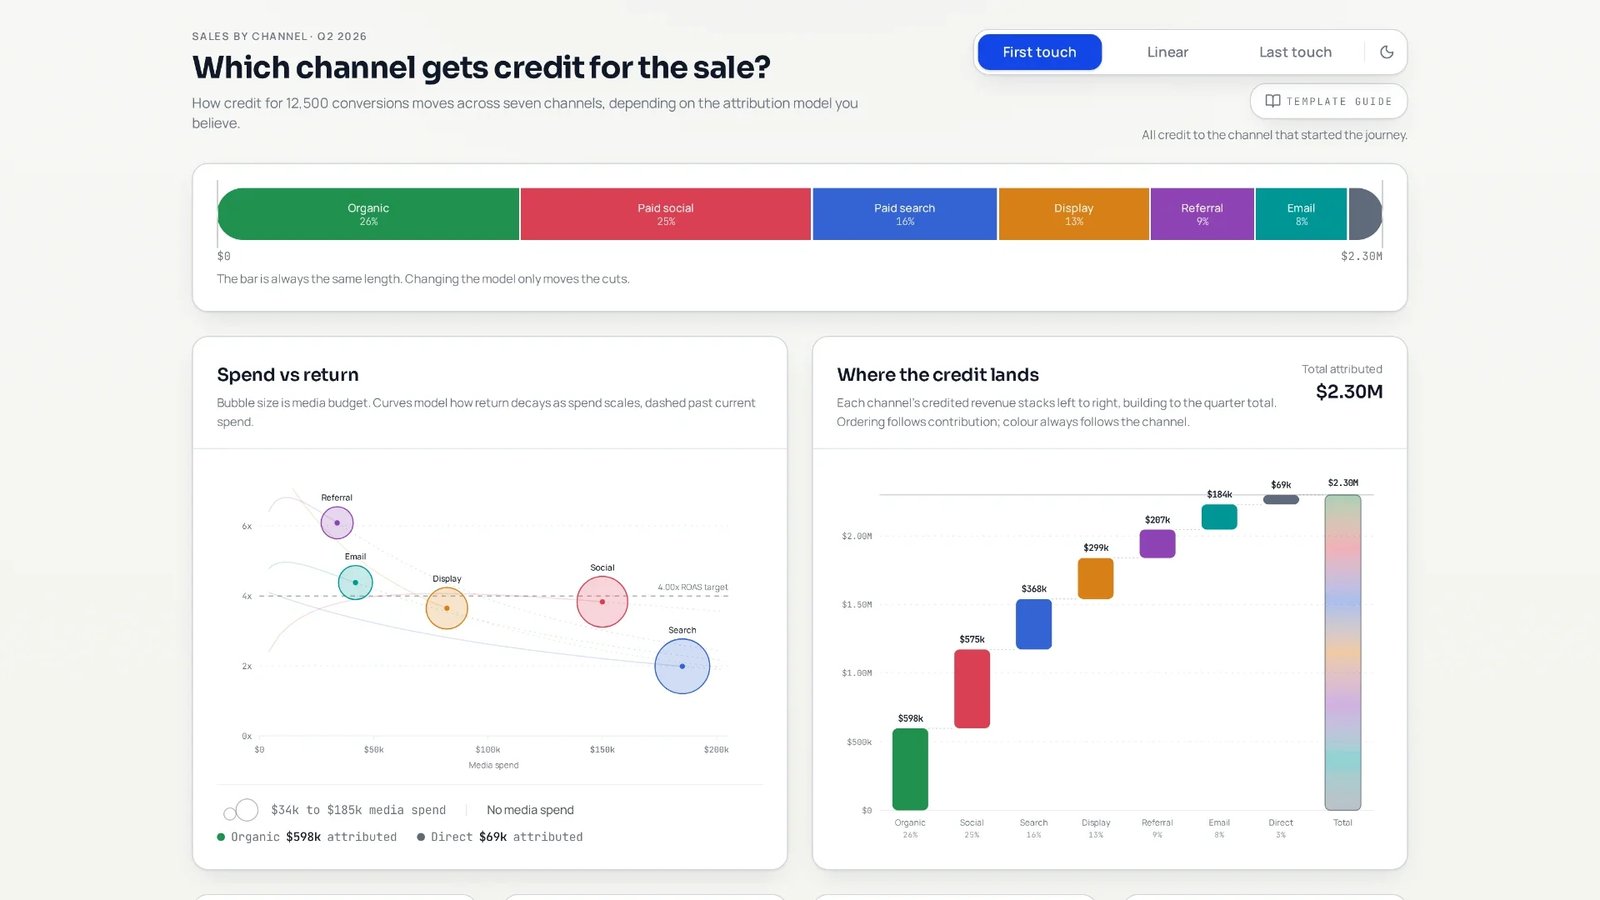
Sales Attribution Dashboard
Three models, one animated revenue rail
Key highlights
Multiple attribution models
Compare how first touch, linear, and last touch logic redistribute revenue across your marketing mix.
Animated data transitions
Smooth visual animations demonstrate the immediate impact of model changes on channel performance.
Fixed revenue tracking
The total revenue figure remains static to ensure data integrity while reallocating credit to different touchpoints.
About this template
This dashboard provides a visual comparison of first touch, linear, and last touch marketing attribution models across seven acquisition channels. Users can toggle between these models to observe how credit shifts between channels while the total revenue remains constant.